S. lycopersicum M82 Fruit Development
Whole Fruit
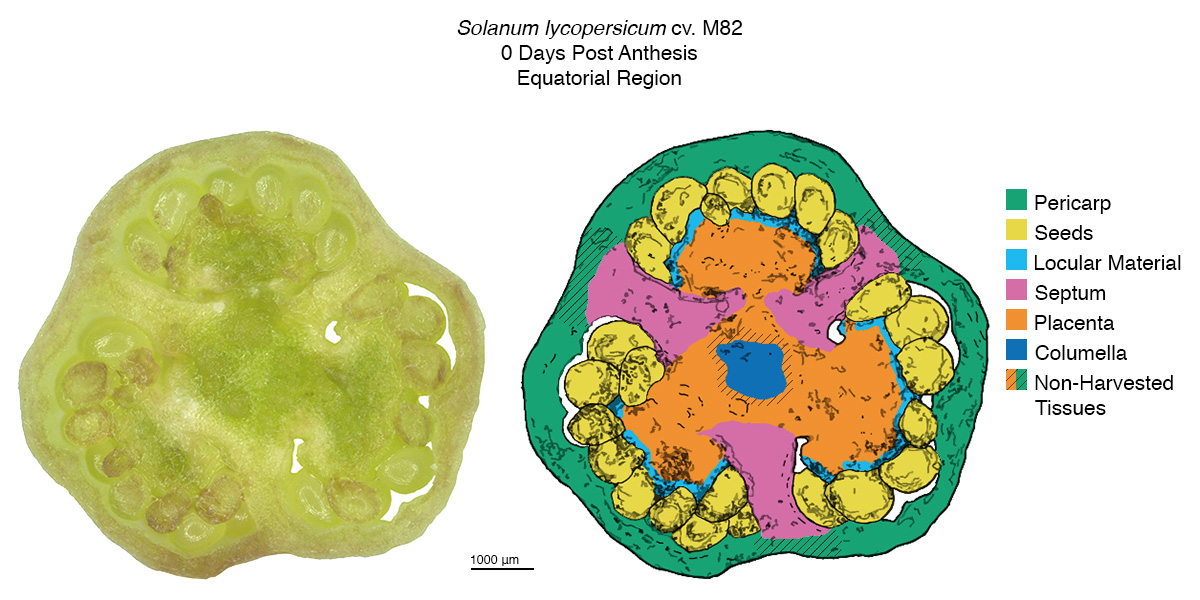
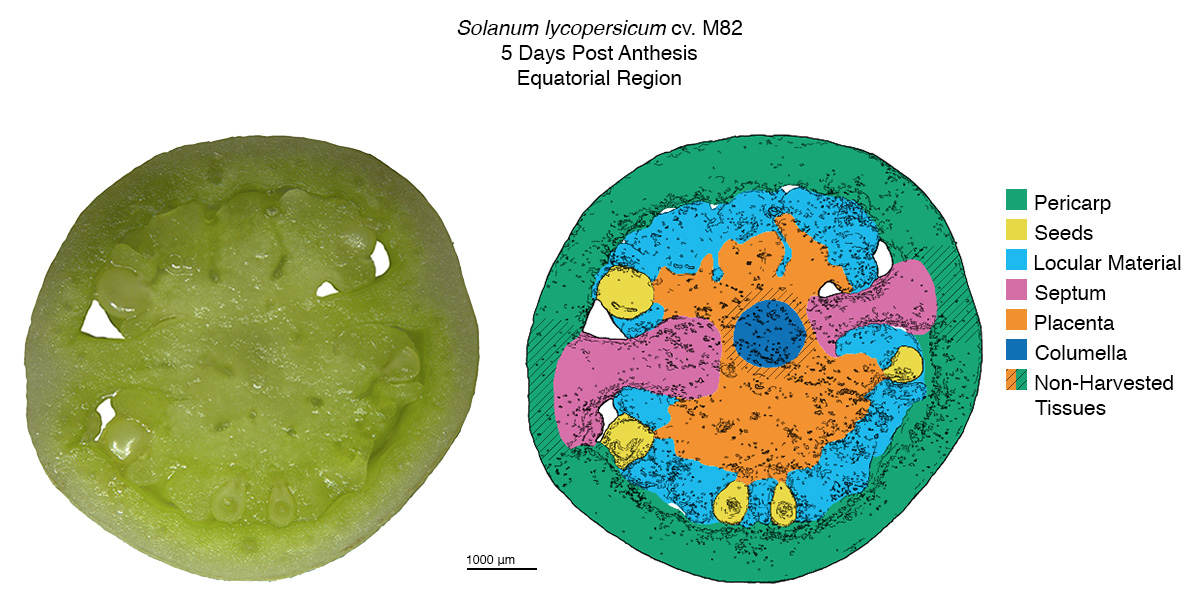
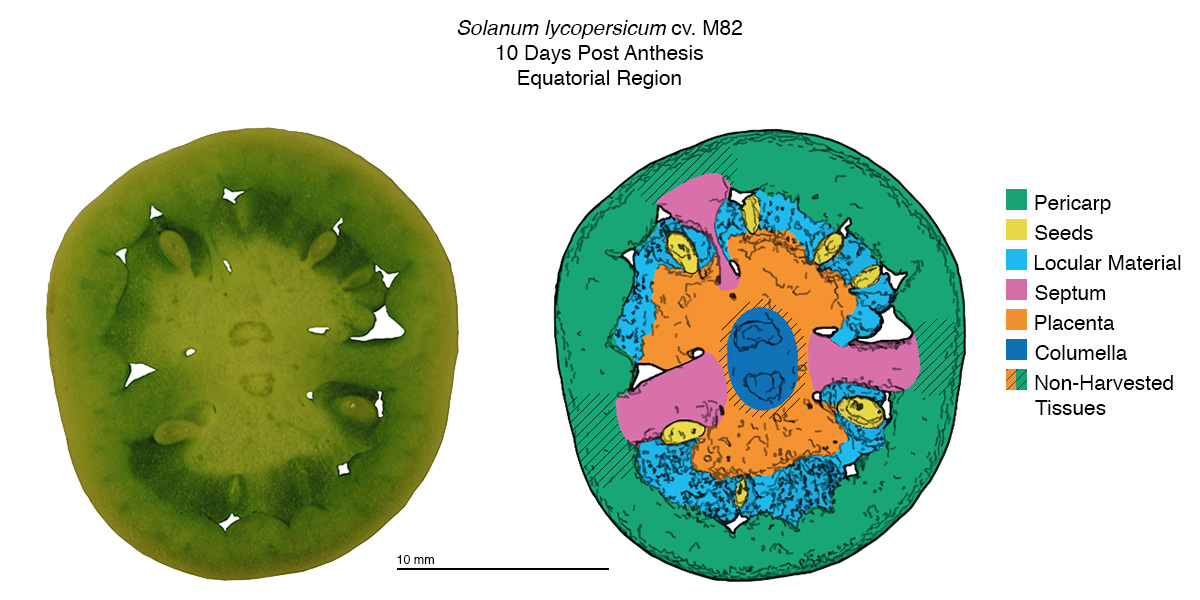
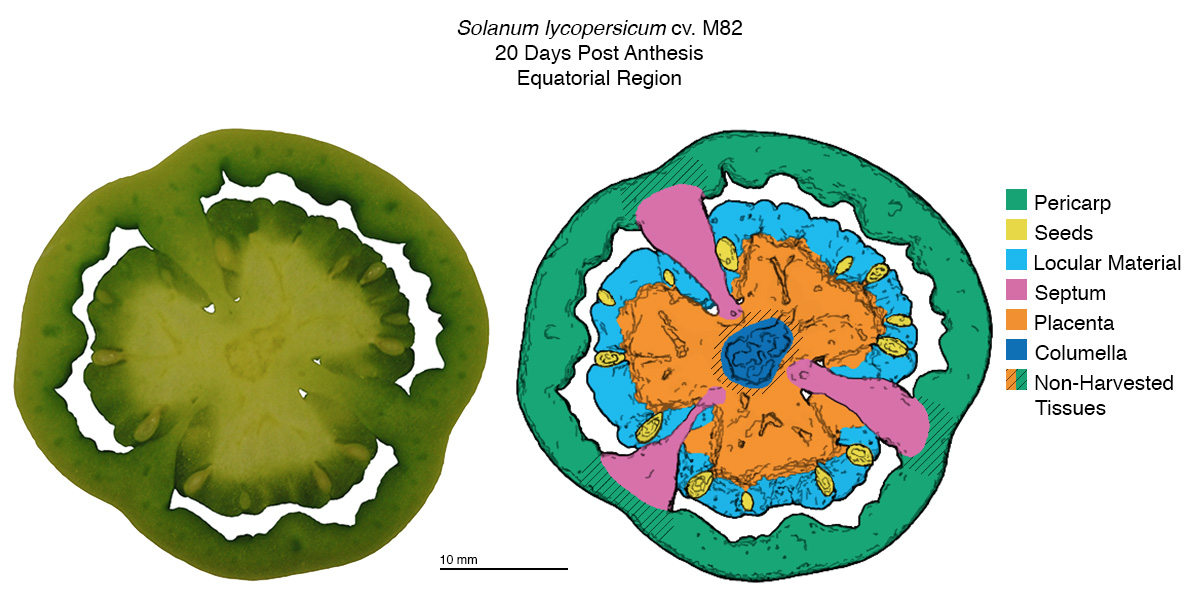
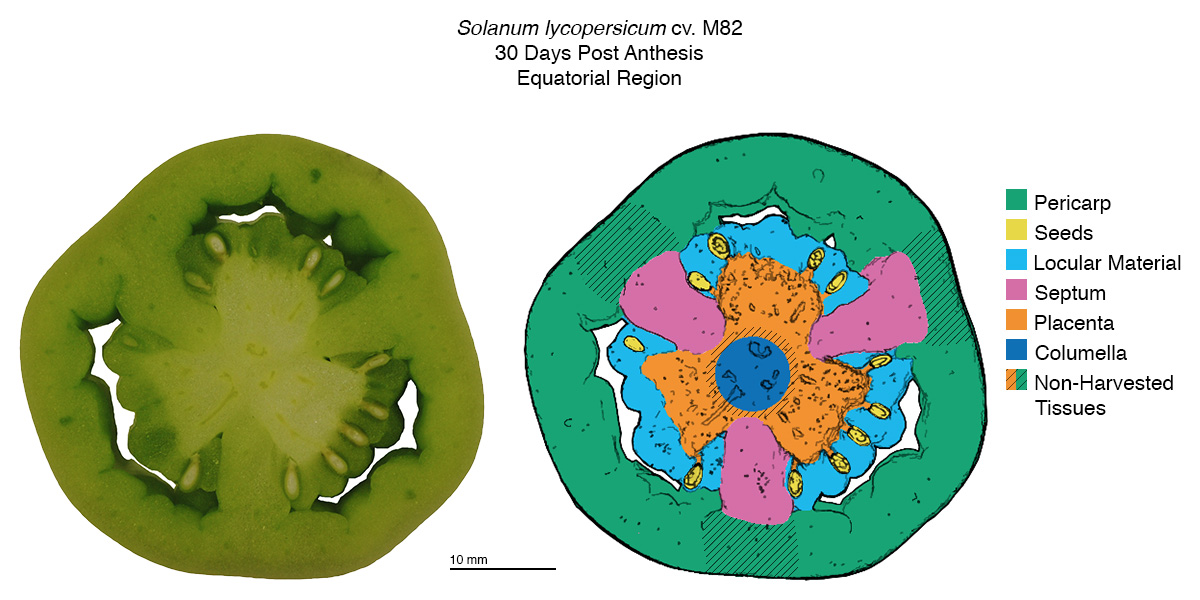
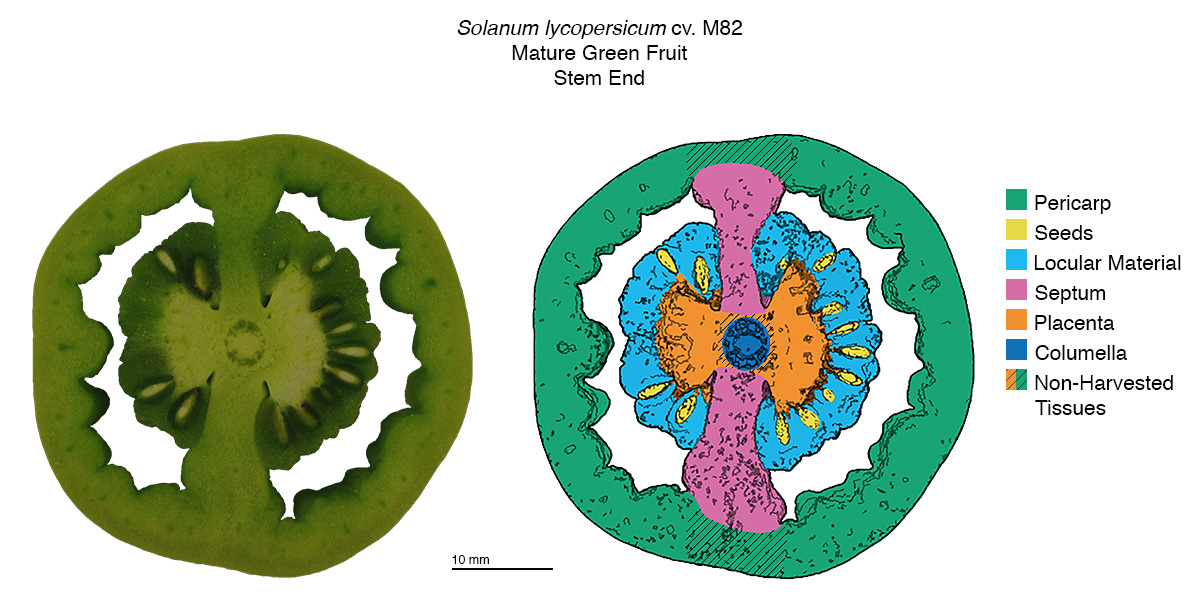
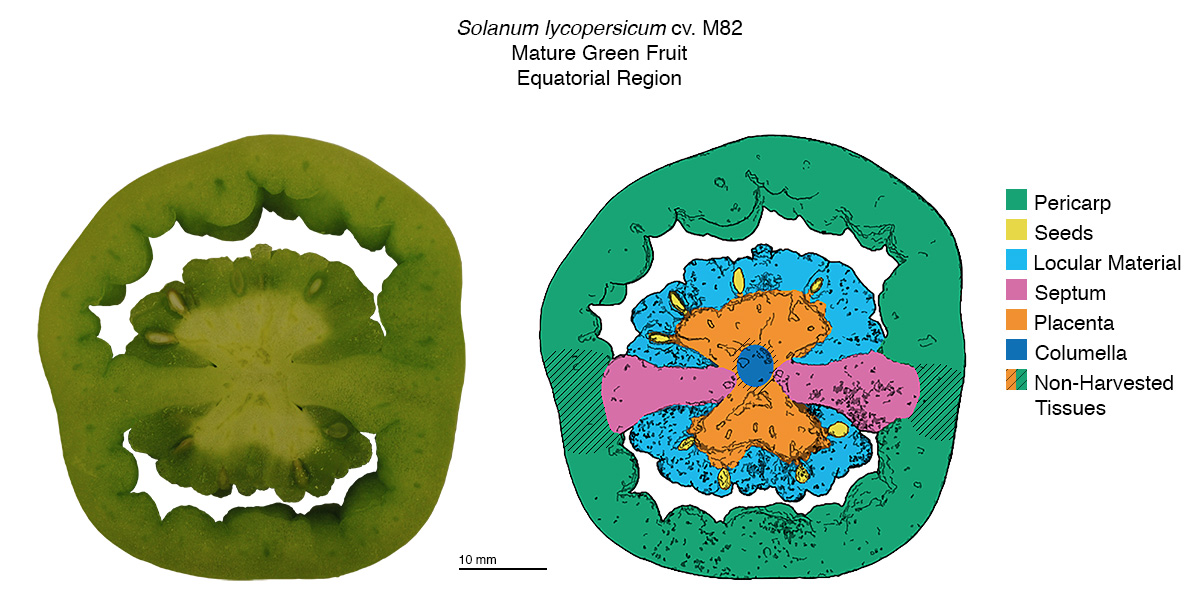
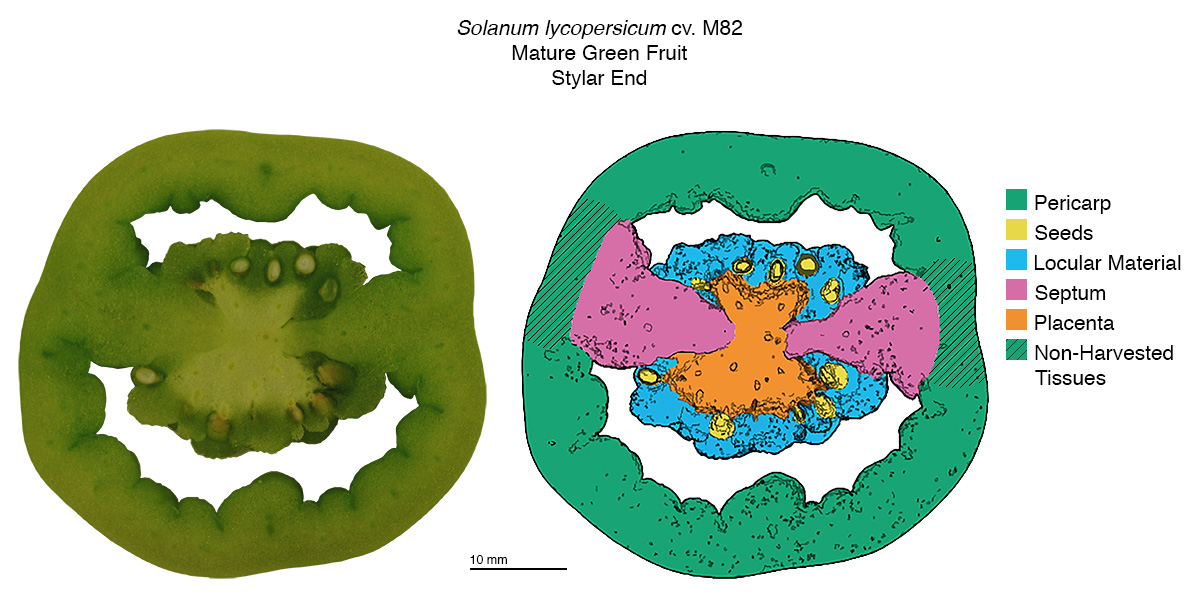
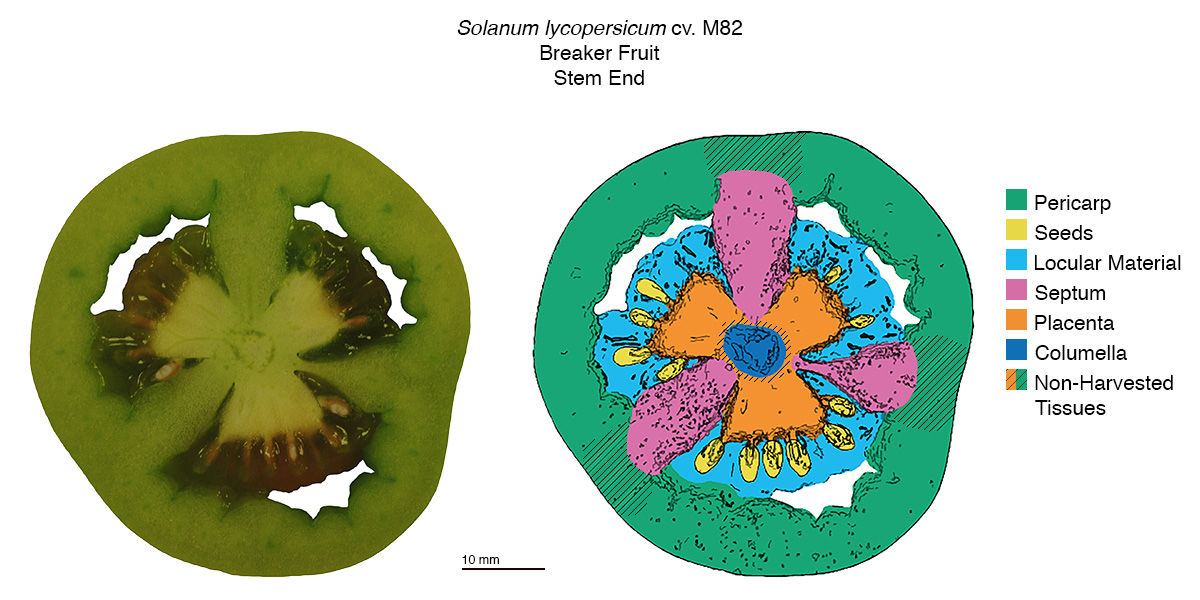
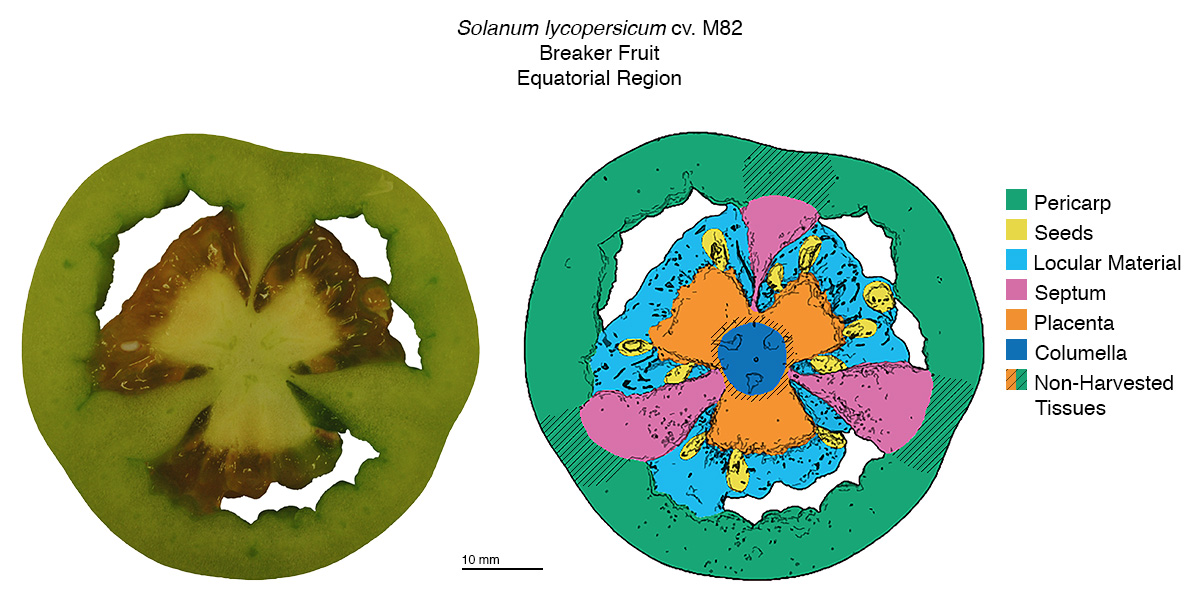
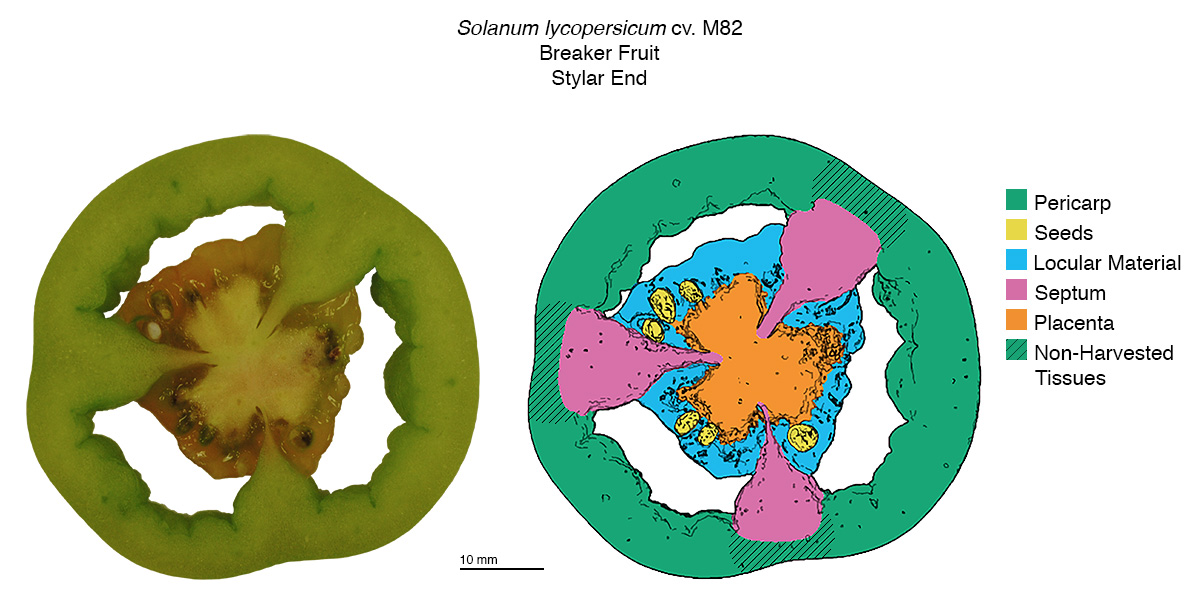
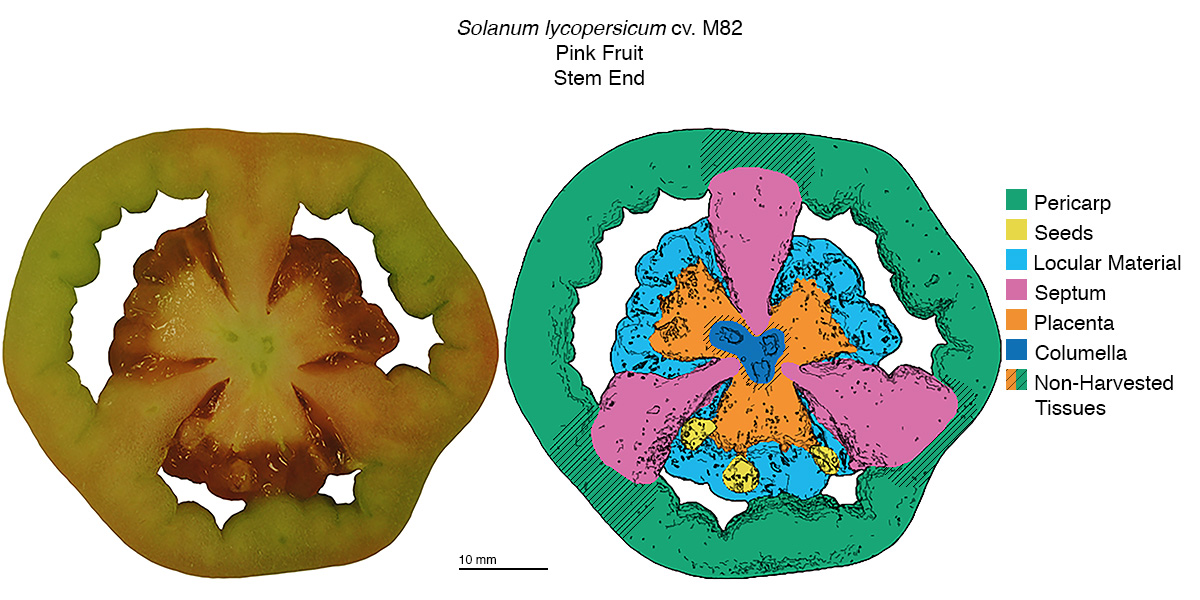
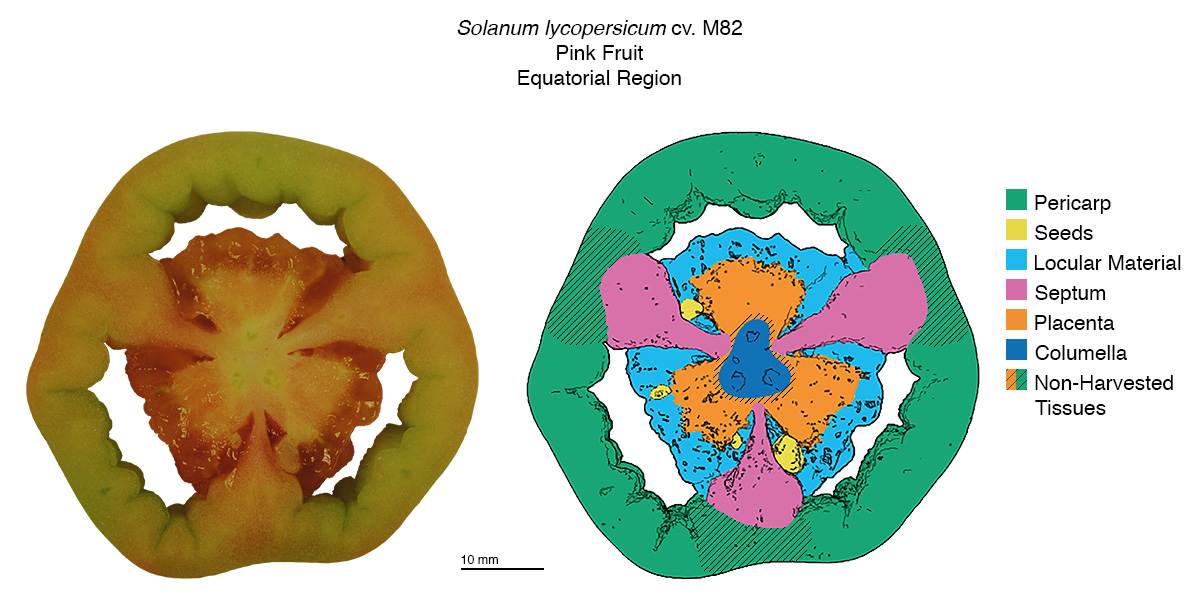
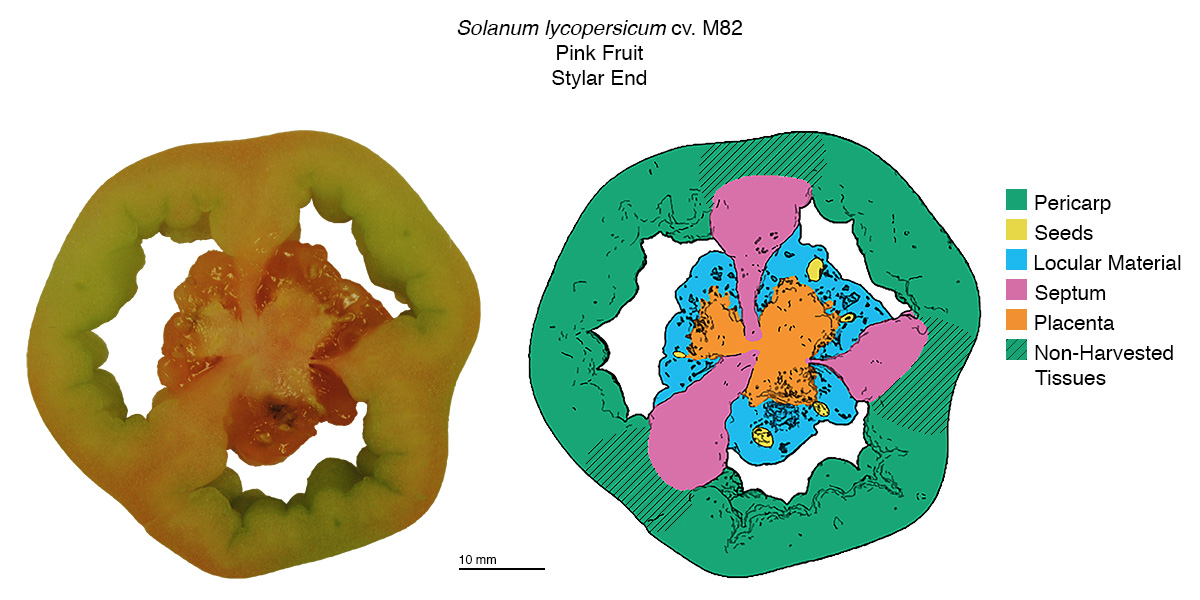
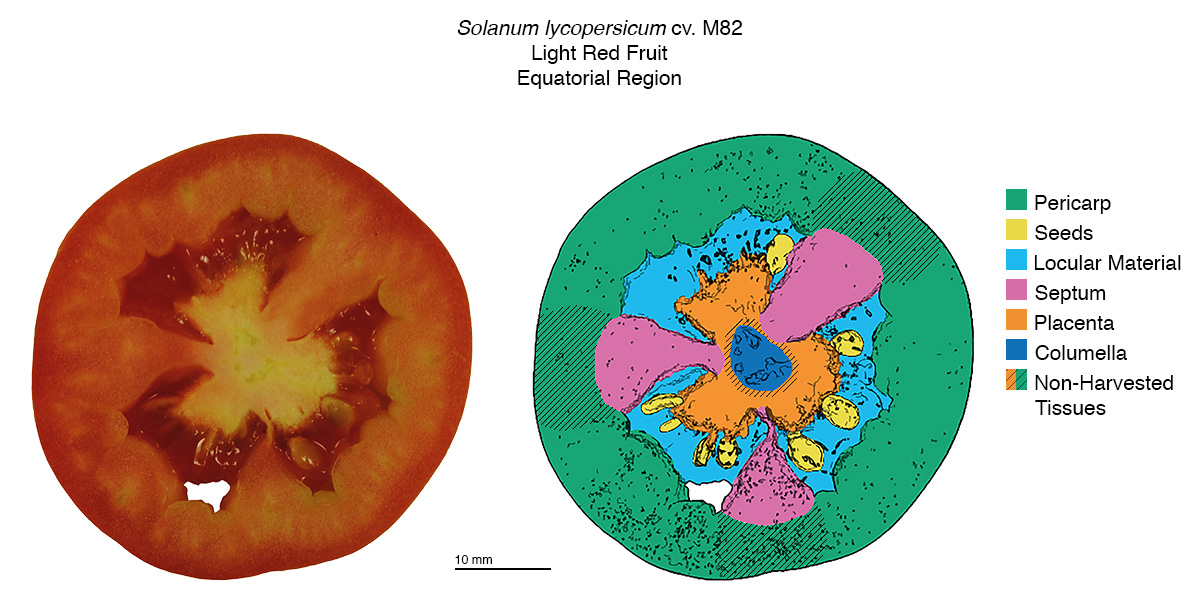
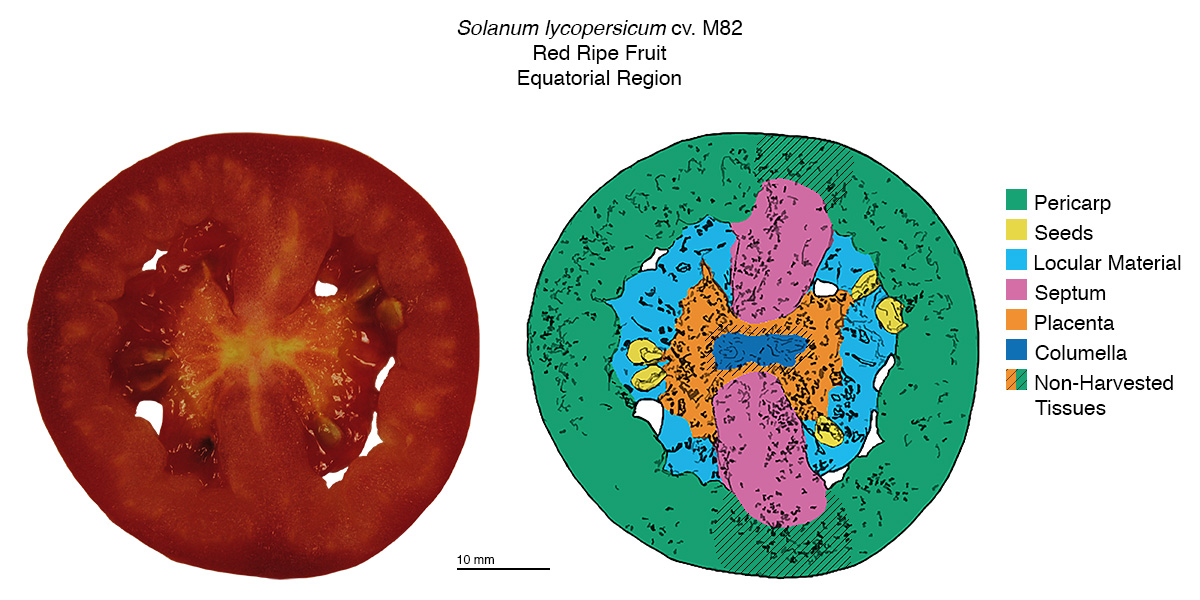
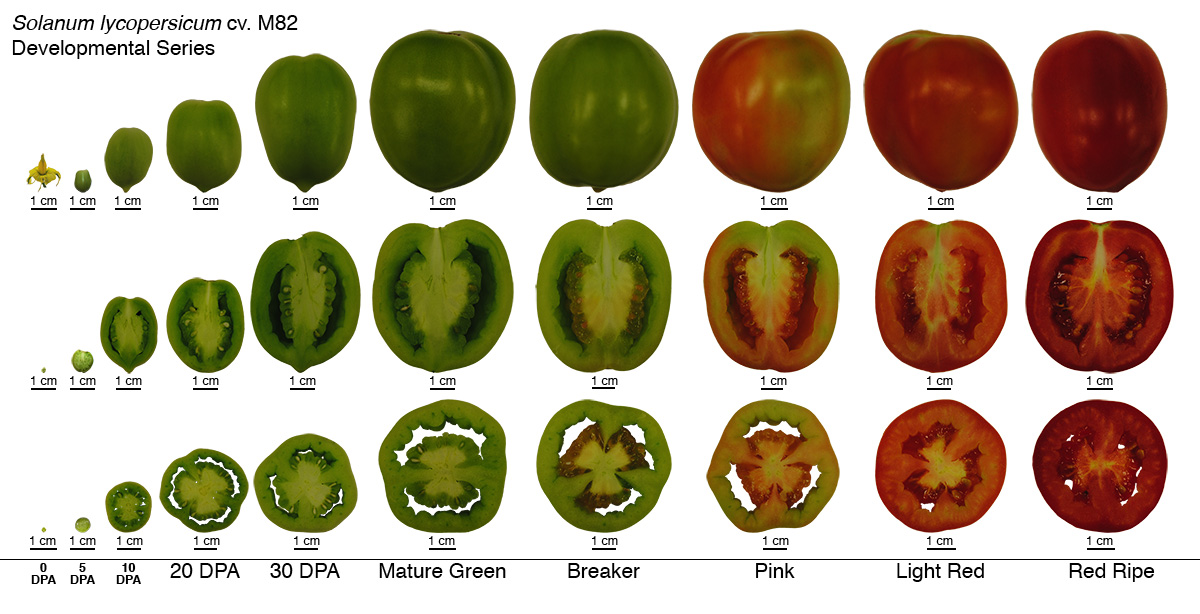
Laser-capture microdissection (LCM) or hand dissection (HD) were used to dissect S. lycopersicum (cv M82) ovaries at anthesis (0 DPA; days post-anthesis), a time point immediately before fruit initiation, as well as fruits during fruit set (5 DPA), phases of rapid expansion (10, 20, and 30 DPA), maturation (Mature Green [MG]), and ripening (Breaker [Br], Pink [Pk], Light Red [LR] and Red Ripe [RR]). Maturity and ripeness stages were defined based on the tomato color chart âUSDA Visual Aid TM-L-1â (USDA Agricultural Marketing Service, 1975). Six fruit tissues were collected from fresh fruits or cryosections: pericarp, ovules/seeds, locular material, septum, placenta and columella. These tissues were also collected from fruits undergoing maturation and early ripening (MG, Br and Pk) at three latitudinal sections (equatorial region, stem-side, and stylar-side) of fruits. Three or four biological replicates of each tissue-type were collected for the production of RNA-seq libraries. Read counts per gene were expressed as reads per million mapped reads (RPM).
| Maturity and ripeness stage | Description |
|---|---|
| Mature Green (MG) | Fully expanded and the surface of the tomato is completely green in color. |
| Breaker (Br) | There is a definite break in color from green to tannish-yellow, pink or red on not more than 10% of the surface. |
| Pink (Pk) | More than 30% but not more than 60% of the surface, in the aggregate, shows pink or red color. |
| Light Red (LR) | More than 60% but not more than 90% of the surface, in the aggregate, shows pinkish-red or red. |
| Red Ripe (RR) | More than 90% of the surface, in the aggregate, shows red color. |
REFRENCES
USDA Agricultural Marketing Service (1975) Color classification requirements in United States Standards for grades of fresh tomatoes. USDA Visual Aid TM-L-1. The John Henry Company, Lansing, MI.
The drawings on this site were derived by taking fruit cross-section photographs and using Adobe Photoshop to convert them into anatomically accurate drawings. This also allows different gene expression levels found in each tissue to be shown in the expression viewer.