Selecting the conditions of the experiment
Once the gene or genes have been selected for the expression analysis, the Project (data set) that is to be queried is then selected, the minimum correlation value for co-expressed genes is chosen and the targeted stages, organs, tissues and treatments are defined from the display in the expression viewer output (Figure 1).
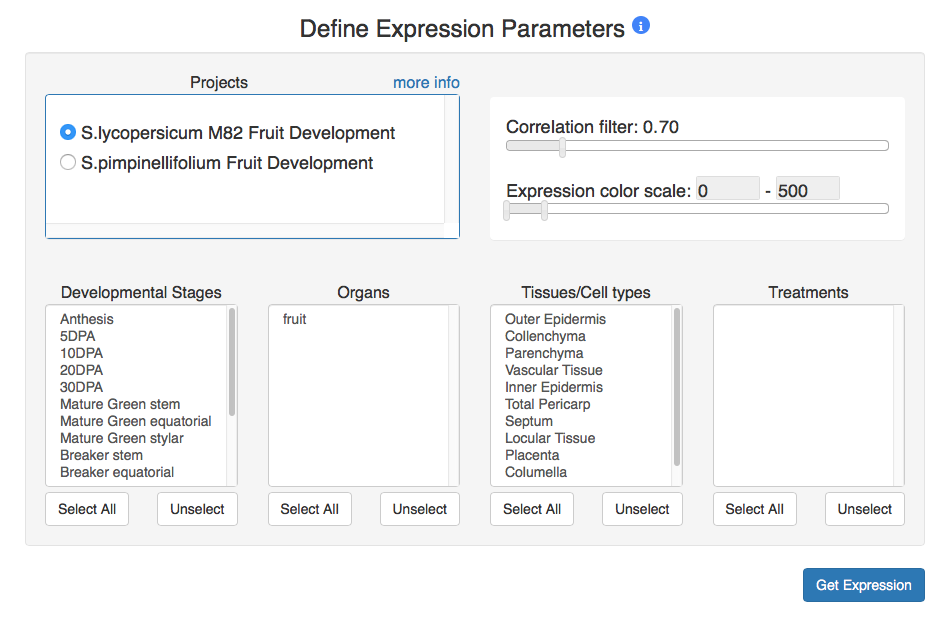
Figure 1. Eligible options for the Expression Viewer.
2.1 Projects
The Project section displays the list of projects (another term for data sets) that are available in the expression atlas.
Selecting one of the projects will show the available stages, organs, tissues and treatments in the selection boxes below.
For example, in Figure 1 the "S. lycopersicum M82 Fruit Development" project is selected and the developmental stages,
organs and tissues for which sequence information has been obtained are shown in the selection boxes.
In Figure 2, the project "S. pimpinellifolium Fruit Development" is selected and the respective stages,
organs and tissues from that project are displayed.
Additionally, on the right-top corner of the projects box there is a link to 'more info' that will open
a new page where the user can find information, figures, articles and links associated with each of the projects.
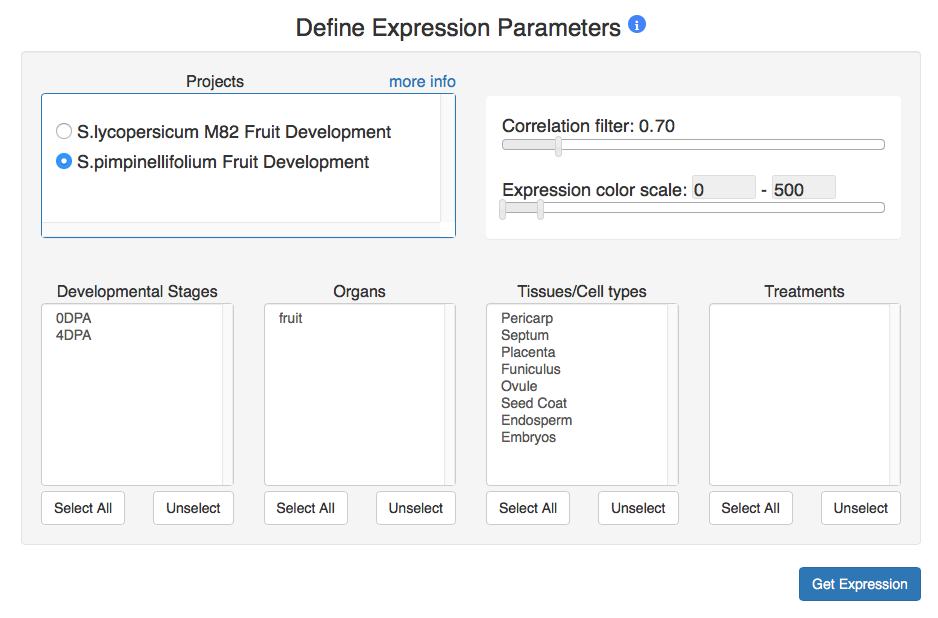
Figure 2. S.pimpinellifolium Fruit Development project selection.
2.2 Correlation filter and expression color scale
A slider bar (Figure 3) allows to the user to set the minimum correlation value (0.65 - 1.0) to display co-expressed genes with similar expression profiles. Higher correlation values will result in more genes being filtered out, giving more conservative correlations. Lower correlation values will result in less strict correlations being included in the analysis. A second slider bar allows the user to set the expression color scale (0 - 5000) for displaying expression data.
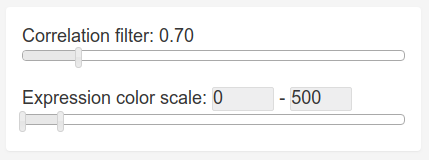
Figure 3. Correlation filter slider and color scale slider.
2.3 Selection of the conditions
Once the project is selected, the user can choose the stages, organs or tissues that will be included in the analysis.
The selection boxes for these conditions are standard HTML elements that allow the user to select one item clicking on it,
or multiple items using the keys shift and/or ctrl keys (Figure 4):
Clicking on one item (e.g. 5DPA in Figure 4),
then holding the key shift and clicking on another item from the selection box (eg. 20DPA in Figure 4),
will result in all items between the two clicked items also being selected (e.g. 5DPA, 10DPA and 20DPA in Figure 4).
Clicking on one item (e.g. Mature Green equatorial in Figure 4) while holding the key ctrl
(use the command key if you are a mac computer user) will add this item to the selection.
Clicking again on the same item holding ctrl will remove this item from the selection.
Select All and Unselect buttons will select or unselect, respectively, all the items from the selection box at once.
Note that when no items are selected all the stages and tissues from the data set will be display.
This is likely to be a common option for most users.
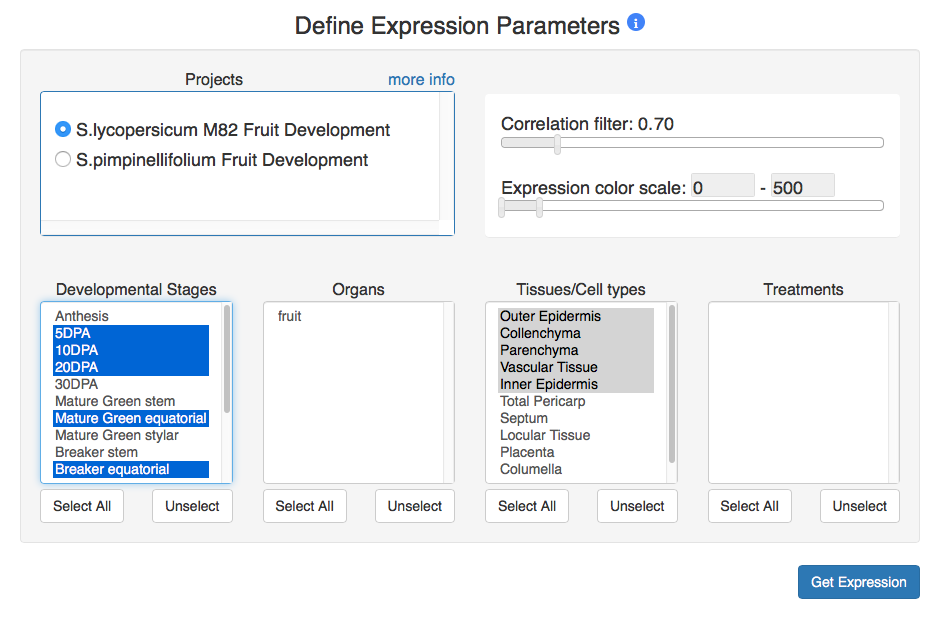
Figure 4. Multiple selection of conditions.
Different selections of the stage, organ, tissue and treatment selection boxes will produce different outputs. For example, when selecting different items from the selection boxes, the shape of the expression cube will adapt to the selected conditions (Figure 5). The figures associated with the expression images and the heatmap in the data output will also change according to the selected conditions.
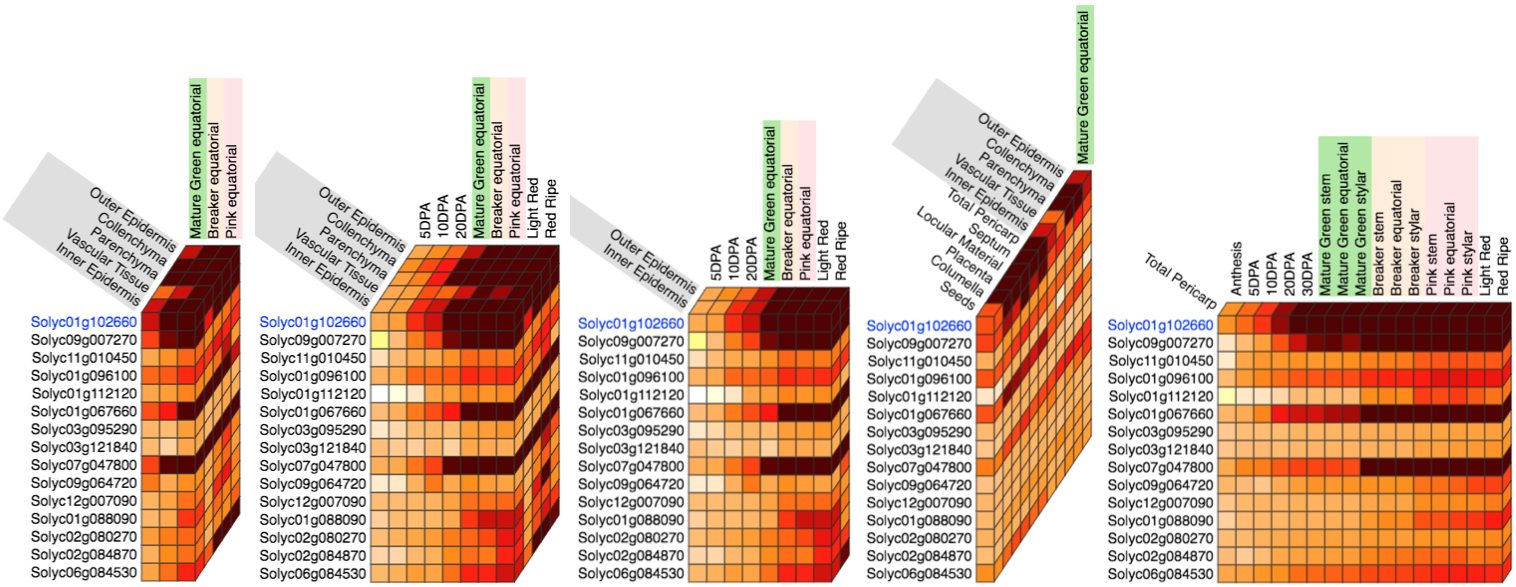
Figure 5. Example of different shapes of the Expression Cube.